

|
StableBit CloudDrive
A secure virtual hard drive, powered by the cloud.
|
Technical Details
(Build 1051)
 |
Technical details is meant for more advanced users. Casual users can skip reading this section. |
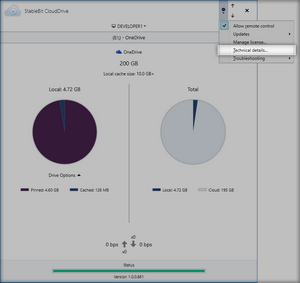
The Technical Details window shows detailed information about how I/O requests are processed with the storage provider, and it gives you some additional advanced troubleshooting options.
The technical details window can be accessed under the Options menu.
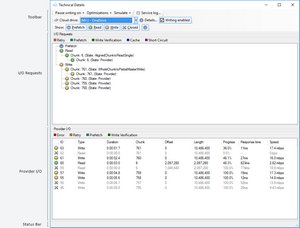
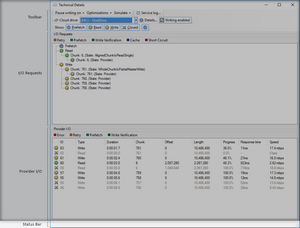
The technical details window consists of a number of parts, the Toolbar, I/O Requests, Provider I/O, and the Status Bar.
 |
Unlike other parts of StableBit CloudDrive, technical details will often substitute the word write for upload, and read for download. Because not all storage providers have to necessarily be network based, these terms are actually more accurate when describing storage providers writing and reading data. |
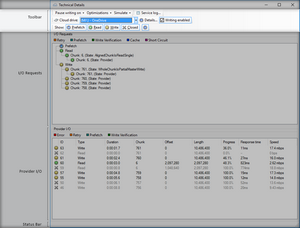
The Toolbar lets you select which cloud drive you want to get technical details about and various other options.
Here's what each part of the Toolbar does:
| Toolbar Parts | |
|---|---|
|
When one of the menu options are selected, StableBit CloudDrive will stop writing data to the storage provider as soon as an error is encountered. Normally, failed writes are retried, and additional data continues to upload. This is useful if you are attempting to use an external tool to record a specific but rare error from the storage provider. The type of error that will cause the writing to pause can be narrowed down further by the available menu options:
| |
|
Optimizations enable or disable certain code optimizations in StableBit CloudDrive. Normally, all optimizations should be enabled.
| |
|
Options to simulate various storage provider errors are available here. All of these error simulations will be turned off on the next reboot (or when the StableBit CloudDrive service restarts).
| |
|
This opens the Service Log window. | |
|
I/O Requests and Provider I/O will only be shown for the cloud drive that is selected here. | |
|
Opens up Drive Details for the selected cloud drive. | |
|
When disabled, uploading to the storage provider will be paused for the current cloud drive. This is the same as unchecking Upload Threads under I/O Performance > Threads. | |
|
When disabled, prefetch requests will not be shown in I/O Requests or in Provider I/O. | |
|
When disabled, read requests will not be shown in I/O Requests or in Provider I/O. | |
|
When disabled, write requests will not be shown in I/O Requests or in Provider I/O. | |
|
When disabled, completed requests will not be shown in Provider I/O after they end. | |
|
When enabled, I/O Requests and Provider I/O will pause updating. This will let you examine the information contained there in detail. | |
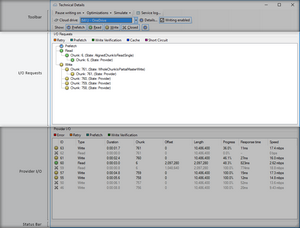
Every time StableBit CloudDrive needs to read some data from a storage provider or write some data to a storage provider, it issues a Read or Write request to the Chunk I/O Pipeline. The chunk I/O pipeline is a state machine that can split, join, and process I/O requests in more complicated ways. The decisions that the chunk I/O pipeline makes depend on your cloud drive settings and the capabilities of the storage provider.
The I/O Requests view, provides a detailed trace of each I/O request as it traverses through the chunk I/O pipeline.
 |
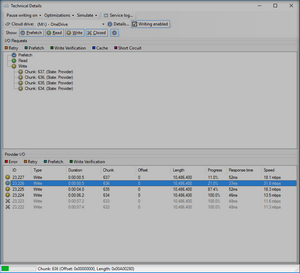
For example, when a part of a chunk needs to be written, and the storage provider doesn't support partial chunk writes (like most cloud storage providers), this may show up in I/O Requests:
|
Each time an I/O request needs to be split, joined, or something more complicated needs to happen, a sub-node will be shown in the I/O Requests view for that request. Hovering your mouse over that node will show you a detailed tooltip of what exactly happened there.
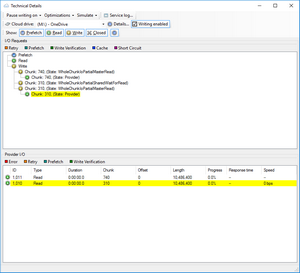
Clicking on the node of a Provider type of I/O request will highlight the corresponding Provider I/O request that was issued to the storage provider as a result.
 |
In the above example, we can see that a part of chunk 310 needs to be written to the storage provider. But the storage provider doesn't support writing parts of chunks, so the entire chunk needs to be read, patched, and written back to the storage provider. Moreover, a similar write request is being issued at the same time, and instead of doing the above twice, both of those requests are being combined into one operation. |
Each I/O requests always starts off as one of 3 types:
-
Prefetch
-
Read
-
Write
But in order to process that request, it may be necessary to issue additional I/O requests of a different type.
The type of I/O request that is being issued at each individual point of an ongoing I/O request is indicated by an icon:
| I/O Request Types | |
|---|---|
|
This is a prefetch read request. | |
|
This is a non-prefetch read request. | |
|
This is a write request. | |
In addition to the I/O request type icon, certain I/O requests are highlighted with different colors for emphasis.
| I/O Request Colors | |
|---|---|
|
| |
|
| |
|
| |
|
| |
|
| |
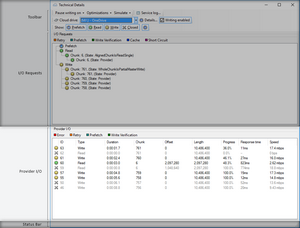
Provider I/O shows detailed information about each I/O request that goes out to the storage provider.
Just like in I/O Requests, each request has an icon associated with it and some possible highlighting for emphasis.
| Provider I/O Icons | |
|---|---|
|
This is a non-prefetch read request. | |
|
This is a prefetch read request. | |
|
This is a write request. | |
|
This request ended successfully. The item will be shown for 4 seconds after it ends. | |
|
This request ended unsuccessfully. Selecting it will show the error message in the Status Bar. The item will be shown for 15 seconds after it ends. | |
| Provider I/O Colors | |
|---|---|
|
| |
|
| |
|
| |
|
| |
This is the information shown for each storage provider I/O request:
-
ID
A unique identifier of this request. This is just an incrementing number.
-
Type
The type of request:
-
Write - A write request.
-
Read (prefetch) - A prefetch read request.
-
Read (verify) - A read request verifying a previous write.
-
Read - A non-prefetch and non-verifying read request.
-
-
Duration
How long this request has been running.

Note that this window only updates about once a second.
-
Chunk
The chunk number that is being read or written.
-
Offset
The 0-based offset in the chunk that is being read or written.
-
Length
The length of the data that is being read or written.
-
Progress
Out of the entire length, how much of it has already been read or written, as a percentage.
-
Response Time
How long it took the storage provider to respond to this request after it was issued.
-
Speed
How fast this request is being read or written, as an average speed from the time that the request was started.
 |
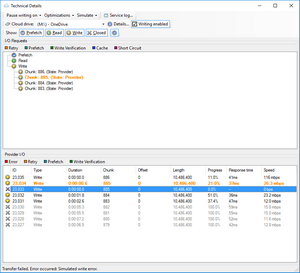
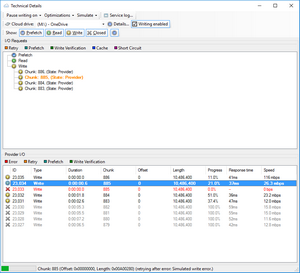
When an error occurs, selecting it will show the error message in the Status Bar.
Similarly, if the request was retried, selecting the retry will also show the error message that triggered the retry. |
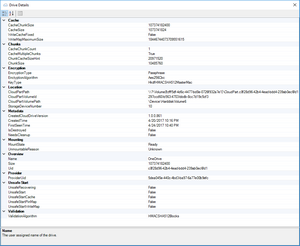
The drive details window shows information about the properties of the selected cloud drive.
Selecting each property will show a brief description of that property at the bottom of the window.
 |
All of these properties are for informational purposes only and they cannot be changed here. |
Here are the categories that the cloud drive properties are grouped into:
-
Cache
Information about the local cache
-
Chunks
Information that has to do with various chunked data.
-
Encryption
Information about full drive Encryption.
-
Location
Path related information.
-
Metadata
Metadata information about the cloud drive.
-
Mounting
Information about the cloud drive's mount state.
-
Overview
General information about the cloud drive.
-
Provider
Information about the storage provider that this cloud drive is using.
-
Unsafe Start
Information about the current state of unsafe start recovery. See Recovering from Errors for more information about unsafe recovery.
-
Validation
Information about the current chunk validation algorithm.
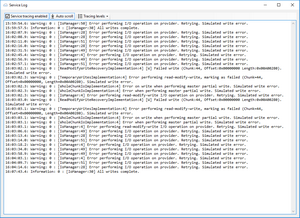
The service log shows the activity of the StableBit CloudDrive background service in real-time.
 |
These messages are also written to log files which are located in %PROGRAMDATA%\StableBit CloudDrive\Service\Logs\Service |
From the toolbar, you can enable or disable logging, toggle auto scroll, as well as select the amount of information to log for each module.
There are 4 logging levels available for each module:
-
Errors
This will only show errors that cause the application to crash.
-
Warnings
This will show any conditions that cause an operation to abort, or an unusual or noteworthy condition, in addition to Errors.
-
Information
This will show trace data, in addition to Warnings.
-
Verbose
This will show detailed trace data, in addition to Information.
 |
Changing the tracing levels here will change them for the log files as well. Tracing levels always reset to their defaults after a reboot (or a service restart). |


